Technical analysis, the cornerstone of financial markets, unveils a world of tools, patterns, and strategies that empower traders to make informed decisions and capitalize on market trends. Delve into this comprehensive guide to unlock the secrets of successful trading.
Introduction to Technical Analysis
Technical analysis is a method used in financial markets to evaluate and forecast future price movements based on historical data. Unlike fundamental analysis, which focuses on company financials and industry trends, technical analysis relies on charts and statistical indicators to make trading decisions.


Traders and investors use technical analysis to identify trends, patterns, and signals in market data that can help them anticipate potential price movements. By analyzing historical price charts and volume data, technical analysts aim to predict future price trends and determine entry and exit points for trades.
Importance of Technical Analysis
Technical analysis plays a crucial role in making trading decisions as it provides valuable insights into market behavior and helps traders time their entries and exits more effectively. By studying chart patterns, trend lines, and technical indicators, traders can develop trading strategies and manage risk more efficiently.
Tools of Technical Analysis
Technical analysis involves the use of various tools to analyze price movements and make informed trading decisions. These tools help traders and investors identify trends, patterns, and potential entry or exit points in the market.
Moving Averages
Moving averages are one of the most commonly used tools in technical analysis. They help smooth out price data to identify trends over a specific period. Traders use moving averages to determine the direction of the trend and potential support or resistance levels.
Relative Strength Index (RSI)
The Relative Strength Index (RSI) is a momentum oscillator that measures the speed and change of price movements. It ranges from 0 to 100 and is used to identify overbought or oversold conditions in the market. Traders often use RSI to confirm trend strength and anticipate potential trend reversals.
Moving Average Convergence Divergence (MACD)
Moving Average Convergence Divergence (MACD) is a trend-following momentum indicator that shows the relationship between two moving averages of a security’s price. Traders use MACD to identify changes in the strength, direction, momentum, and duration of a trend. It helps traders spot potential buying or selling opportunities.
Comparison and Contrast
When comparing moving averages, RSI, and MACD, it’s essential to understand their respective strengths and weaknesses. Moving averages are great for identifying trends, while RSI is excellent for measuring momentum. MACD combines elements of both trend-following and momentum indicators, making it a versatile tool for traders. Each tool has its unique characteristics and applications, but when used together, they can provide a comprehensive analysis of price movements in the market.
Chart Patterns
Chart patterns are key tools used in technical analysis to predict potential price movements in financial markets. These patterns are formed by the price movements of an asset over time, and they can provide valuable insights into market sentiment and potential future price directions.
Identifying and interpreting chart patterns requires a keen eye for detail and an understanding of the various patterns that can occur. By recognizing these patterns and understanding their implications, traders and investors can make more informed decisions regarding their positions in the market.
Head and Shoulders Pattern
The head and shoulders pattern is a bearish reversal pattern that signals a potential trend change from bullish to bearish. It consists of three peaks – a higher peak (head) flanked by two lower peaks (shoulders). This pattern indicates that buyers are losing control and that a potential downtrend may be imminent.
Double Tops/Bottoms
Double tops and bottoms are reversal patterns that occur when the price reaches a high (double top) or low (double bottom) twice before reversing direction. These patterns indicate that the market is struggling to break through a certain level of support or resistance, signaling a potential reversal in the current trend.
Triangles
Triangles are continuation patterns that can be either bullish or bearish, depending on their formation. Symmetrical triangles indicate a period of consolidation before a potential breakout, while ascending triangles suggest a bullish bias and descending triangles suggest a bearish bias. Traders often look for a breakout from the triangle pattern to confirm the direction of the next price movement.
Support and Resistance Levels
Support and resistance levels are key concepts in technical analysis that help traders identify potential price levels where a security may experience a pause or reversal in its current trend.
Identifying Support and Resistance Levels
Support levels are price levels where a security tends to find buying interest, preventing it from falling further. Traders identify support levels on a price chart by looking for areas where the price has reversed direction multiple times in the past, creating a floor for the price.
Resistance levels, on the other hand, are price levels where a security tends to encounter selling pressure, preventing it from rising further. Traders identify resistance levels by pinpointing areas where the price has reversed direction multiple times, forming a ceiling for the price.
Significance of Support and Resistance Levels
– Support and resistance levels help traders determine entry and exit points for their trades.
– These levels can act as psychological barriers for traders, influencing their buying and selling decisions.
– Breakouts above resistance or breakdowns below support levels can signal potential trend reversals in the market.
Trend Analysis
In technical analysis, trend analysis is crucial for understanding the direction in which a security’s price is moving. By identifying trends, traders can make informed decisions about when to buy or sell a particular asset.
Trends can be categorized into three main types:
– Uptrend: When the price of an asset is consistently making higher highs and higher lows over time.
– Downtrend: When the price of an asset is consistently making lower lows and lower highs over time.
– Sideways trend: When the price of an asset moves within a horizontal range without a clear upward or downward direction.
Identifying and Confirming Trends
To identify and confirm trends, technical analysts use various indicators such as moving averages, trendlines, and the Relative Strength Index (RSI). These tools help traders filter out noise and focus on the underlying trend of the asset.
- Moving averages: Traders use moving averages to smooth out price data and identify the overall direction of the trend. A simple moving average (SMA) calculates the average price over a specific period, while an exponential moving average (EMA) gives more weight to recent prices.
- Trendlines: Trendlines are diagonal lines drawn on a price chart to connect significant lows or highs. An upward sloping trendline confirms an uptrend, while a downward sloping trendline confirms a downtrend.
- Relative Strength Index (RSI): The RSI is a momentum oscillator that measures the speed and change of price movements. Traders use the RSI to identify overbought or oversold conditions, confirming the strength of a trend.
By using technical indicators to identify and confirm trends, traders can anticipate potential price movements and make informed trading decisions.
Importance of Trend Analysis
Trend analysis is critical in predicting future price movements and determining the optimal entry and exit points for trades. Traders who can accurately identify trends have a competitive edge in the market and can capitalize on profitable opportunities.
- Trend analysis helps traders avoid trading against the prevailing market direction, reducing the risk of losses.
- Understanding trends allows traders to ride the momentum of a security, maximizing profit potential.
- By analyzing trends, traders can develop effective trading strategies based on the direction of the market.
Volume Analysis
Volume is the number of shares or contracts traded in a security or market during a given period. In technical analysis, volume plays a crucial role in confirming price trends and providing insights into market sentiment. High volume typically indicates strong interest in a particular security, while low volume may signal a lack of conviction among traders.
Role of Volume in Technical Analysis
- Volume analysis helps confirm the validity of price trends. When a price movement is accompanied by high volume, it suggests that the trend is more likely to continue. On the other hand, if a price movement occurs on low volume, it may indicate that the trend is weak and could potentially reverse.
- Volume can also provide clues about the strength of a trend. Increasing volume as prices move in a certain direction is often seen as a sign of a healthy trend, while decreasing volume may indicate that the trend is losing momentum.
- The relationship between price movements and volume is important for traders to analyze market dynamics and make informed decisions. By studying volume patterns alongside price movements, traders can gain a better understanding of market behavior and potential future price movements.
Moving Averages
Moving averages are a key tool in technical analysis for smoothing out price data and identifying trends over a specific period of time. There are several types of moving averages used, including simple moving averages (SMA), exponential moving averages (EMA), and weighted moving averages.
Types of Moving Averages
- Simple Moving Average (SMA): This is calculated by taking the average closing price of a security over a specific number of periods.
- Exponential Moving Average (EMA): This type of moving average gives more weight to recent prices, making it more responsive to price changes compared to SMA.
- Weighted Moving Average: This moving average assigns different weights to each data point, giving more importance to certain periods over others.
Using Moving Averages in Technical Analysis
Moving averages are commonly used to identify trends in the market. When the price of a security is above its moving average, it is considered to be in an uptrend, while a price below the moving average indicates a downtrend. Additionally, moving averages can act as dynamic support and resistance levels, where the price tends to bounce off the moving average.
Combining Moving Averages for Trading Strategies
- Golden Cross: This strategy involves the crossover of a short-term moving average (e.g., 50-day SMA) above a long-term moving average (e.g., 200-day SMA), signaling a potential uptrend.
- Death Cross: In contrast, the death cross occurs when the short-term moving average crosses below the long-term moving average, indicating a possible downtrend.
- Moving Average Crossover: Traders can also use the crossover of two moving averages (e.g., 20-day EMA and 50-day EMA) to generate buy or sell signals.
Candlestick Patterns
Candlestick patterns are a crucial aspect of technical analysis in trading. They provide valuable insights into market sentiment and potential price movements based on the patterns formed by the open, high, low, and close prices of an asset within a specific timeframe.
When interpreting candlestick patterns for trading decisions, traders look for patterns that indicate possible trend reversals, continuation of trends, or potential entry and exit points. Understanding the significance of each pattern and how it relates to market psychology is key to making informed trading decisions.
Common Candlestick Patterns and Their Significance
- Bullish Engulfing: This pattern occurs when a large bullish candle completely engulfs the previous bearish candle, signaling a potential reversal from a downtrend to an uptrend.
- Doji: A Doji candle has the same open and close price, indicating indecision in the market. It can signal a potential reversal or continuation depending on the context.
- Hammer: A Hammer candlestick has a small body and a long lower wick, suggesting a potential reversal from a downtrend to an uptrend.
It is essential to consider the context in which a candlestick pattern forms and look for confirmation from other technical indicators before making trading decisions.
Interpreting Candlestick Patterns for Trading Decisions
- Confirmation: Traders often wait for confirmation from the following candle to validate the signal given by a candlestick pattern.
- Stop-loss Placement: Setting stop-loss orders based on candlestick patterns can help manage risk and protect trading capital.
- Price Targets: Using the height of the candlestick pattern to set price targets can help traders establish realistic profit targets.
Psychology Behind Candlestick Patterns and Market Sentiment
- Candlestick patterns reflect the psychological battle between buyers and sellers in the market.
- Patterns like bullish engulfing show that buyers have gained control and are likely to push prices higher.
- Understanding market sentiment through candlestick patterns can help traders anticipate potential price movements and make better trading decisions.
Risk Management in Technical Analysis
Risk management is a crucial aspect of trading, especially when utilizing technical analysis. It involves strategies and practices to minimize potential losses and protect capital while aiming to maximize profits. Setting stop-loss levels based on technical analysis is one of the key methods used in risk management to control potential losses and exit trades if the market moves against expectations.
Setting Stop-Loss Levels
- Identify key support and resistance levels on the price chart.
- Set stop-loss levels just below support levels for long positions and above resistance levels for short positions.
- Adjust stop-loss levels as the trade progresses to lock in profits or limit losses.
- Consider the volatility of the market and the timeframe of the trade when setting stop-loss levels.
Strategies for Managing Risk
- Diversify your trading portfolio to spread risk across different assets.
- Use proper position sizing to ensure that a single trade does not risk a significant portion of your capital.
- Implement risk-reward ratios to ensure that potential profits outweigh potential losses in each trade.
- Utilize trailing stop-loss orders to protect profits as the trade moves in your favor.
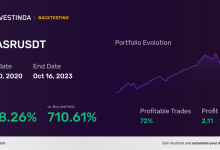
Backtesting and Strategy Development
Backtesting trading strategies using historical data is a crucial step in evaluating the effectiveness of any trading strategy. By simulating trades based on past market data, traders can assess how well their strategies would have performed in the past and make necessary adjustments to optimize future performance.
Importance of Backtesting
Backtesting allows traders to validate their trading ideas and assumptions, helping them understand how the strategy would have fared in different market conditions. It also provides valuable insights into the risk and reward potential of the strategy, helping traders make more informed decisions.
- Backtesting helps in identifying flaws in the trading strategy before risking real capital.
- It provides a way to measure the consistency and profitability of the strategy over time.
- By backtesting different variations of a strategy, traders can fine-tune their approach for better results.
Developing and Optimizing Trading Strategies
When developing trading strategies based on technical analysis, it is essential to follow a systematic approach to ensure robustness and reliability.
- Start with a clear understanding of the market conditions and trends you want to capitalize on.
- Use a combination of technical indicators and chart patterns to generate trade signals.
- Set clear entry and exit criteria based on your risk tolerance and profit targets.
- Optimize your strategy by adjusting parameters and testing different variations to improve performance.
Last Word
In conclusion, technical analysis equips traders with the necessary arsenal to navigate the complexities of financial markets. By mastering the tools, patterns, and strategies discussed, one can embark on a journey towards profitable trading ventures with confidence and precision.

Hi, I’m Lauren. As a digital enthusiast and storyteller, I love breaking down complex ideas into easy-to-read articles. My goal is to provide readers with fresh perspectives and helpful solutions through every piece I write.